Quick Started Demos for Ginkgoch Map Library
- 2019-12-30
- Ginkgoch
This page represents several simple demos for core functions of Ginkgoch Map Library. In this page, I won’t introduce any other web, desktop or mobile frameworks to build rich UX application; but only use few lines of code to show the feature of its mapping capabilities. Simple features are basis of building complex mapping software, isn’t it?
Prerequisite
Before we kick start the demos, we need to do some preparations.
- canvas is a 3rd party graphics library that our map component relies on. It depends on Cairo v1.10.0 or later. Choose the corresponding command to install the dependencies.
- macOS:
brew install pkg-config cairo pango libpng jpeg giflib librsvg - Ubuntu:
sudo apt-get install build-essential libcairo2-dev libpango1.0-dev libjpeg-dev libgif-dev librsvg2-dev Fedora:sudo yum install gcc-c++ cairo-devel pango-devel libjpeg-turbo-devel giflib-devel- Solaris:
pkgin install cairo pango pkg-config xproto renderproto kbproto xextproto OpenBSD:doas pkg_add cairo pango png jpeg giflib`- Windows see this wiki for detail
- macOS:
- Install the dependency with
yarn add canvas ginkgoch-map.
The demo required data (*.shp, *.json, *.csv) are located in the
datafolder in this parent folder for sharing data across multiple sample categories.
Demos
Each js file is a standalone demo. Execute it with node [replace with js file name].
Quick Started
Render a simple map
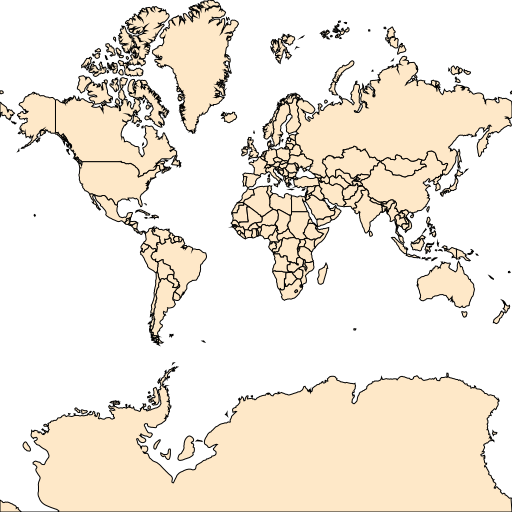
render-simple-map.js represents how to load a shapefile and render into an image.
Render a colorful map
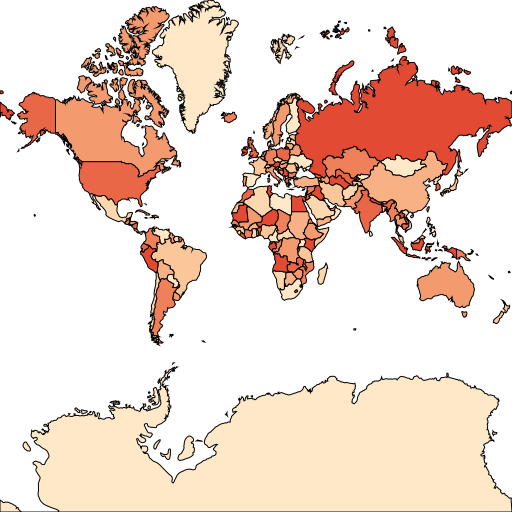
render-colorful-map.js represents how to load a shapefile, then extract its property table and find out the distinct field values. When we got the distinct values, it automatically generate a ValueStyle to set an exclusive FillStyle for each values.
Tutorial Begins
From this section, I will introduce the very basic demos through geometry, spatial analyze, style renderer, source and layers. I try to use pretty simple demo for example with brief code to show you how to implement a small part in a GIS app. When you understand the very little functions, you could build up a complex and robust cross platform mapping software by putting them together.
Use Geometries
Create geometry and data visualization
create-geoms.js represents how to create point, polygon and line geometries; then set a specific style base on various geometry type and render them into an image.
Buffer geometry by distance
spatial-buffer.js represents how to buffer a geometry with a specific distance. See the following images for difference.
Buffers with
4degrees
Buffers with
20degrees
Other spatial analysis
We provides more built-in spatial analysis functionalities, the other demos are in WIP…
Use Styles for data visualization
Use simple styles
Actually, we already represents many basic styles within the previous demos. Such as FillStyle, LineStyle or PointStyle. So I will skip those styles and show you some other interesting styles.
Use value based style
Imagine a feature source that has some specific value I am interesting, while the others are not; within the interesting values, I also want to render different colors based on the values. ValueStyle will be the one to satisfy this scenario.
Here represents two various scenarios for using this style.
In folder data/Africa, we include an Africa shapefile. Here attaches the top 3 records to show you how the field values structure.
| ID | CODE | COUNTRY |
|---|---|---|
| 1 | ALG | Algeria |
| 2 | ANG | Angola |
| 3 | ANG | Angola |
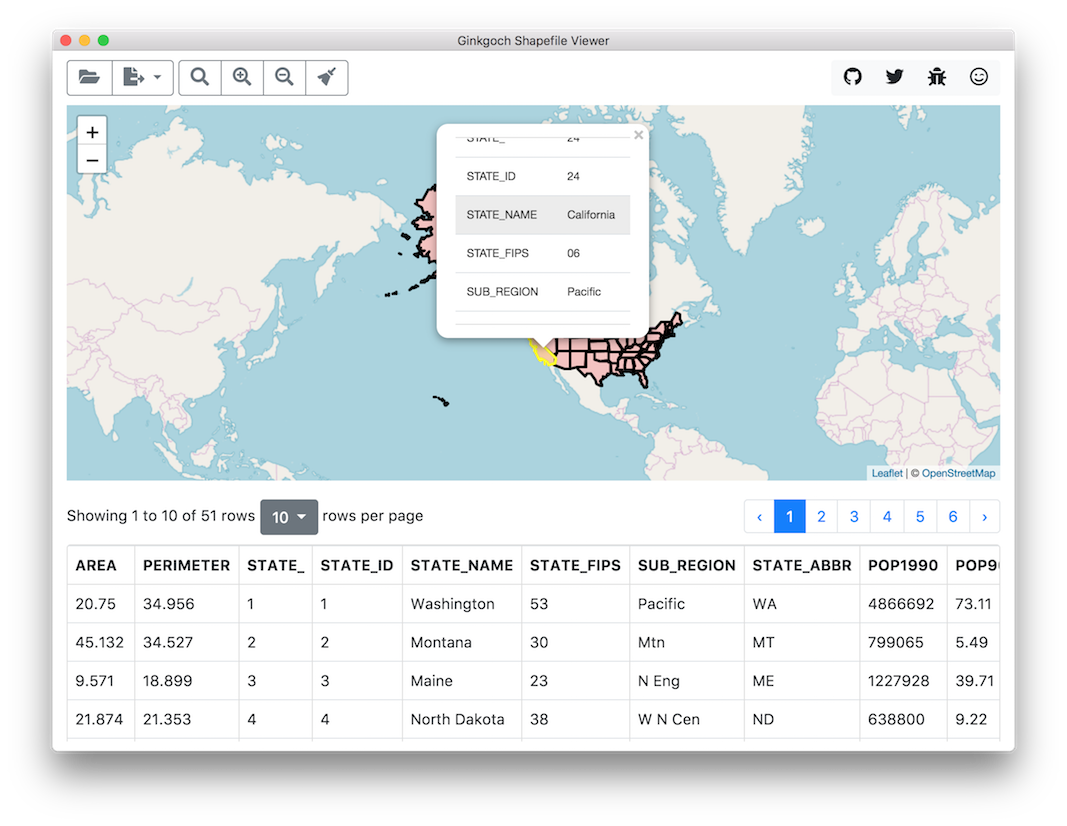
I have a cross platform (can run in macOS, Linux and Win so far) mapping application for desktop Shapefile Viewer that allows to load shapefile, and render on based on a shapefile. Then you can visually tell what the shapefile looks like and the features it includes.
If GUI is too heavy to you, here is also a command line tool to use.
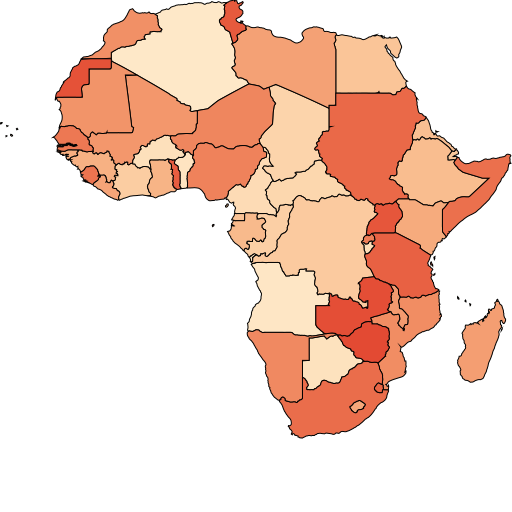
Render areas based on values
use-value-style.js represents how to set an exclusive fill colors based on field CODE.
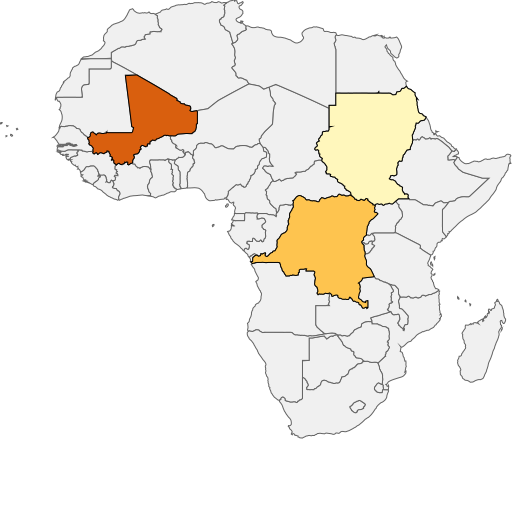
Filter and render areas based on some specific values
render-filter-values.js represents how to filter and render areas with field values MAL, ZAI and SUD only.
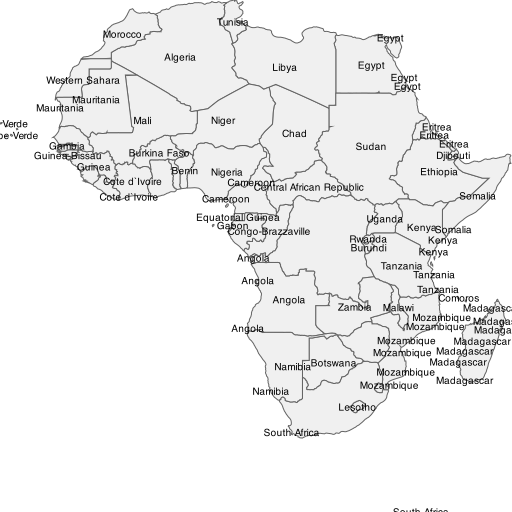
Use Text Style
Labels are pretty important for data visualization. We also support it. Check out use-text-style.js for how to use TextStyle to put text on a map. This style automatically ignore the overlapping labels. If some label for small area not drawn, try to zoom in deeper and you could see it when there is enough space for this label and no overlapping labels around it.
Layers and Sources
As the samples represented previously, in the mean time, the FeatureSource and FeatureLayer are also used in the previous demos (e.g. render-colorful-map.js). Here I just emphasize there difference.
FeatureSourceis a base class to help to fetch features from a specific map source data. We will create various kinds of map source by extending this base class. For example, we will useShapefileFeatureSourceto fetch features fromShapefilewhileMemoryFeatureSourceis used to store temporary features in memory. There will be lots of kind of data sources in GIS region. I will introduce more later.FeatureLayeris a major container ofFeatureSourceandStyle. We can assume thatLayeris utils to accommodateFeatureSourceandStylefor rendering your customized map surface.
Summary
In this page, I introduced some basic guide for Ginkgoch map library. It is a very low level SDK of building cross platform mapping software programmatically. I’m now planning to do some advanced guide to build RESTful APIs, and cross platform GUI applications. Hope you enjoy it.
Thanks for reading. Happy Mapping!