Build a XYZ Map Server with MAP Library
- 2020-01-06
- Ginkgoch
In the previous page: Quick Started Demos for Map Core, I introduced the basic features of Ginkgoch Map Library. It allows developers to draw a map with shapefiles or features with thematic styles, then store it as an image on disk. It is a pretty simple and pure demo which could only guide to build some console utilities. But Ginkgoch Map Library is far more powerful than that for crafting web mapping software.
I used to announce that Ginkgoch Map library allows to build cross platform server, desktop and mobile applications with only JavaScript. So today, I will try to challenge to build an interactive map.
Scenario
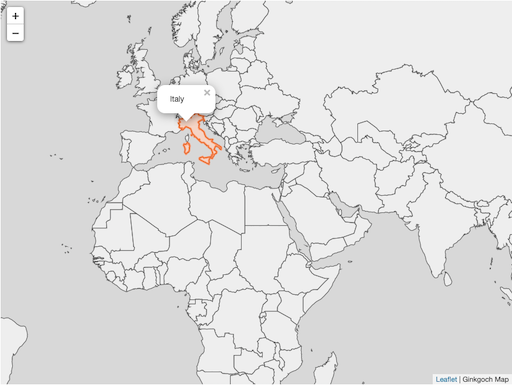
I want to build an Africa mapping software only on browser, I have my own Shapefiles (Countries.shp, Africa.shp). I want to set my own color for those data. Besides the static map, I want to interact with the map. Click an area and make it highlighted. See the demo at (https://github.com/ginkgoch/map-quick-started-demos/tree/develop/services)
This is how it looks like finally. Let’s do it!
Prerequisite
Again, Ginkgoch Map Library is a low level SDK which only focus on building mapping software for spatial analysis and data visualization. At this stage, we need some other frameworks associate to build service, desktop, mobile mapping software easier. Fortunately, Ginkgoch Map Library is compatible with them. e.g. working with KOA to build RESTful or web mapping softwares, working with Electron to build desktop and React Native for mobile apps. In the near future, I will write more documents to cover them. But in this article, let’s focus on map server or web more.
- Koa - a lightweight web framework for node
- Koa Router - a router engine for Koa framework
- Koa Body Parser - a body parser middleware
- Canvas - the native graphics engine for node
- Ginkgoch Map Library - for server side spatial analysis and data visualization
- Leaflet - a front-end map library
1 | yarn add @koa/router canvas ginkgoch-map koa koa-bodyparser koa-static leaflet |
In the next step, I’m going to build a RESTful service with XYZ tile API.
Build XYZ Tile Service
Create a simple service with KOA
To setup a basic service is the first step. It is pretty easy to create a service with following code.
1 | const Koa = require('koa'); |
Create the map tile router
We design the tile API as GET: /maps/:name/:z/:x/:y. :name is the name of your map state. :z, :x and :y mean the zoom level, column and row of a specific tile.
With this API design, the router could implement like this map-router.js
1 | /** Note: |
Service ready
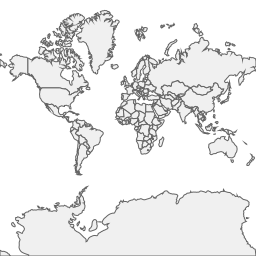
Let’s open a browser and type url localhost:3000/maps/default/0/0/0, the tile image with the world map will respond.
At this step, we know how to an API for XYZ tile. How could we build an interactive map? Let keep working on the front-end part in the next section.
Build interactive map view with Leaflet
In this section, we will work on front-end only - build interactive map view with Leaflet (you could choose any client map library such as OpenLayers as well).
In our demo, we put all client code under assets folder and copy the leaflet related resources underneath the assets/deps folder.
Then create assets/index.html as following:
1 |
|
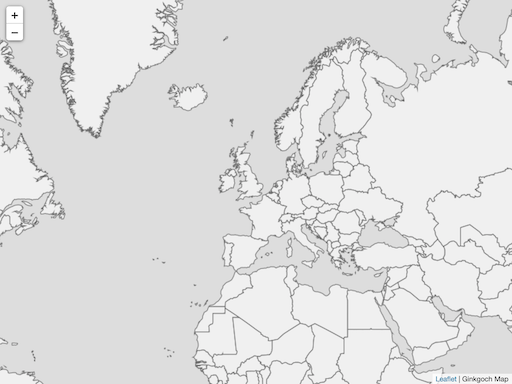
That’s all for our basic web mapping software. I will try to make those steps as a template just help to build the server and client part easier later. With the power of Leaflet, you could drag to pan the map and scroll to zoom on the map.
Identify the countries by clicking
We have one last feature not implemented - identify. It is a pretty common spatial analysis which allows you to click on the map, find out what countries are intersected within the clicked area, and prompt a popup to show the information.
Identify - Client
This time, we are working from client by clicking to send the clicked location.
1 | mapView.on('click', e => { |
It seems a little more code, but every line is useful (we can remove some, but our code avoid to create duplicated instances which will have better performance).
Identify - Server
There are many ways to design the server side implementation. But due to we want to make this project as a template later, I will try to avoid to write duplicated code. So basically, we already have an XYZ API for fetching tile images. Then we only need one more post API to handle all the other interactions, such as this identify operation.
So we will define a contract between client and server. It refers to the redux implementation, every post data comes with two factors: action and payload. action is a string to tell server what will do, action tells server, what will be used for the action. e.g. this scenario, we want to do the identify, then the action could be SPATIAL_IDENTIFY which means I want to do a spatial analyze about identify (hope that makes sense). The payload will include where the identification location.
Recall the client code, we post with this code: postBack('SPATIAL_IDENTIFY', { latlng, zoom }); which means the clicked latitude, longitude and current map view’s zoom level.
The server implementation:
1 | router.post('/maps/:name/do', async ctx => { |
Identify - Complete
Now, let’s start the server by running node index.js in terminal and input the URL (http://localhost:3000) in browser; click an area on the map and it will highlight; click again will popup the country name.
Summary
It is a pretty long doc, but follow it step-by-step could help to understand the designing and concrete workflow of building a web mapping software. It can be much simpler, here we only uses Ginkgoch map library with basic APIs. later, we could start to use some high-level APIs to reduce the code.
Happy Mapping!